Introduction
The world’s most common cancer, skin cancer, is a disease that strikes one in five people by age 70. Unlike cancers that are developed inside your body, skin cancer forms on the outside of the skin. If spotted on time, most all cases are curable if they are diagnosed early enough. Therefore, detecting what a lesion represents is vital to patient outcomes, with a 5-year survival rate dropping from 99% to 14% depending on stage of detection[3]. Melanoma, the most serious type of skin cancer, occurs when the pigment-producing cells, also known as lesions, give color to the skin and become cancerous.
The International Skin Imaging Collaboration released the largest skin image analysis challenge to automatically diagnose pigmented lesions towards melanoma detection. We decided to use this dataset and test multiple classifiers to find the best method of skin cancer lesion detection.

Data
Data Collection
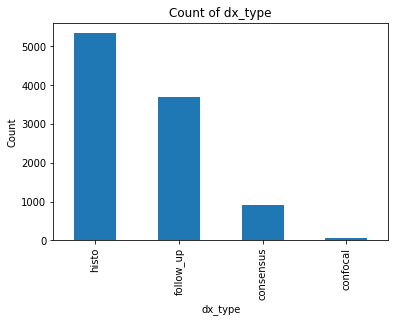
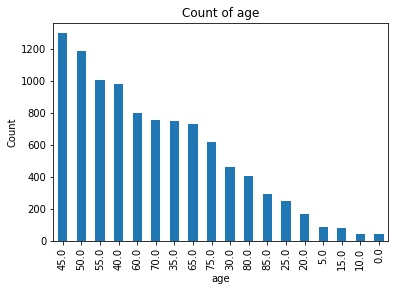
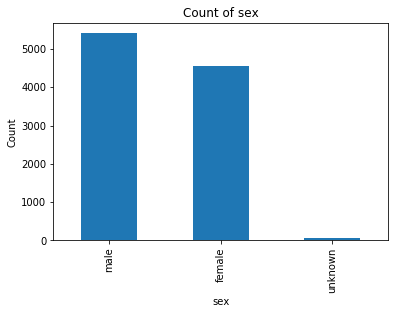
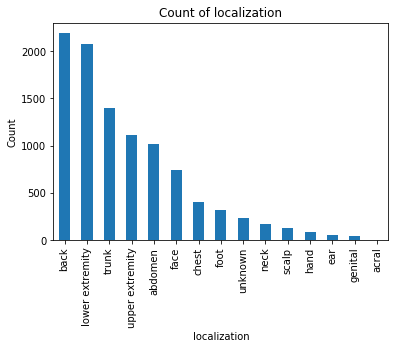
The dataset was originally retrieved from Harvard University’s datacenter and consists of 10,015 dermatoscopic images[5] of pigmented lesions. Dermatoscopic images are images that eliminate surface reflection allowing scientists to look further into the levels of the skin. Additionally this dataset comes with 7 main values: lesion, image, diagnosis, diagnosis method, age, gender, and location of the lesion. The dataset includes all the representative categories of skin lesions - such as benign, pre-cancer (actinic keratosis), low risk (basal cell carcinoma) and malignant forms (melanoma).
 |
 |
 |
 |
 |
Data Preprocessing
For the CNN and MobileNet architectures, we used Keras’s built in ImageDataGenerator class. This allowed us to shear, zoom, and flip the image horizontally in a random fashion. This data augmentation approach will hopefully allow the model to not overfit and have a better training accuracy. Specifically we used a shear range of [0,0.2] and zoom from [0,0.2]. The data was split into 2 separate segments, a csv file and a set of images. Our preprocessing consisted of 5 steps:
$1.$ Pull csv and image data into 2 separate variables
$2.$ Separate labels from the rest of the features in the csv. This will make our ground truth and our dataset1
$3.$ We also wanted to try training on the pixels so we append pixel values to the rest of the features and save it as our dataset2
$4.$ For both datasets we convert the string formatted data into unique integers
$5.$ Drop the IDs
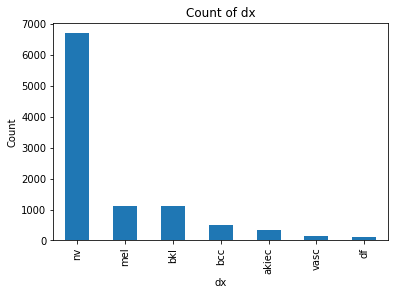
We also decided to try cleaning up our data a bit because there were an unnaturally high amount of “nv” labels and it seemed like our classifiers were only training on that. To try and fix that we created 2 frameworks:
$1.$ Downsample the points with nv labels: We randomly selected about 5500 points which had nv as their label and
dropped it from the dataset. This saw a more even distribution in our data, but it also resulted on less data to
train and test on. $$ $$
$2.$ Remove the labels with lower amount of data: We wanted to see how accurate the classifier would be with less
labels so it would have an easier time detecting differences from nv. This meant we couldn’t properly classify
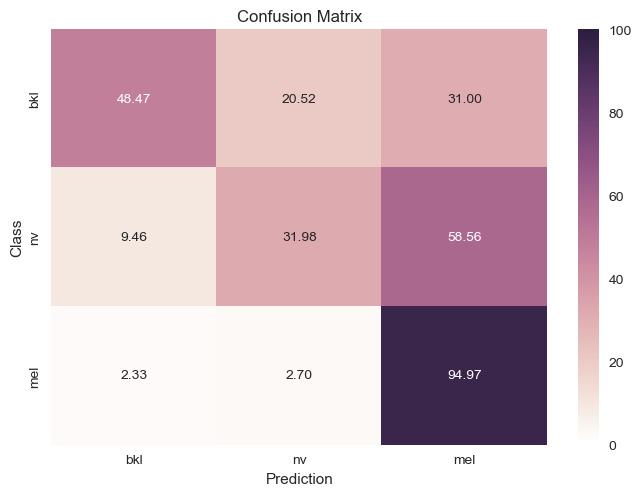
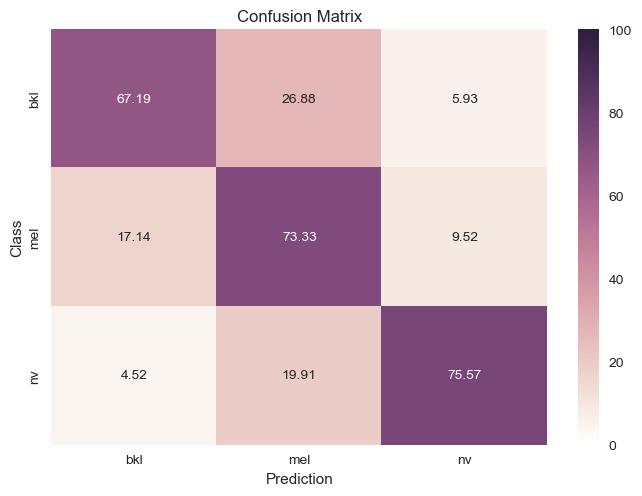
approximately 4 other types of skin cancer, but it had a slightly better confusion matrix as seen below.
Methods
We intend to apply unsupervised, supervised, and transfer learning methods to images from the “Skin Lesion Analysis Toward Melanoma Detection 2018”[4] dataset.
Unsupervised Learning
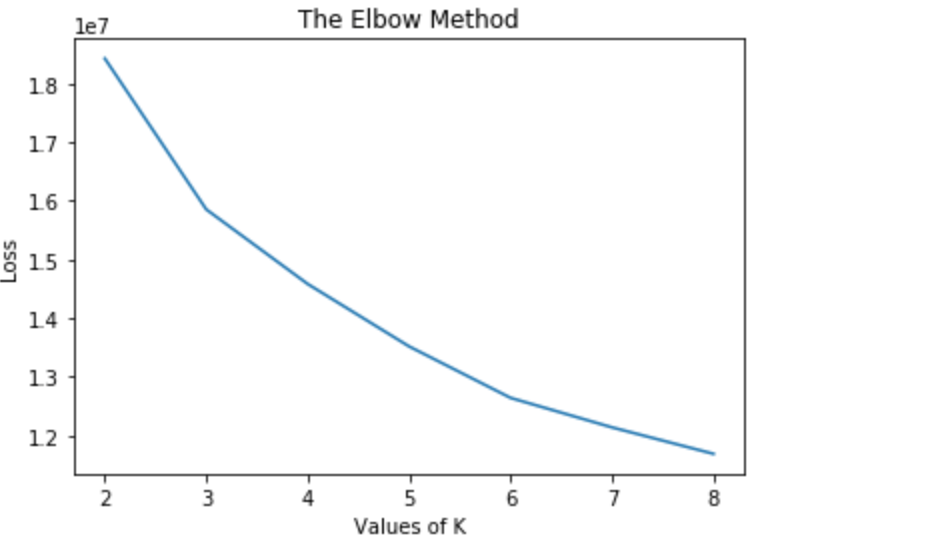
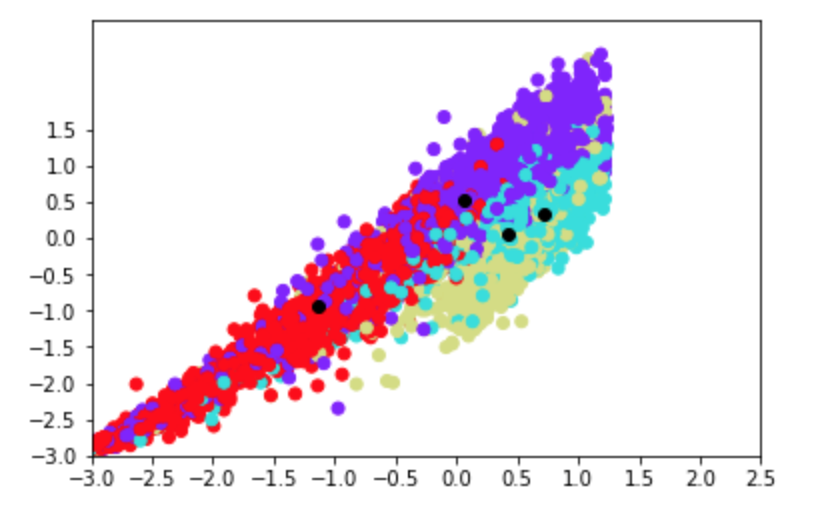
We used K-Means as a naive and initial method of partitioning data into a fixed number of clusters and compare these clusters to our desired classifications.
Dimensionality reduction
The images we used to train our classifiers consisted of a large number of dimensions (2353 pixels per image). To better understand the dimensionality of our data and get a sense of how separable the different classes are, we applied dimensionality reduction algorithms - Principal Component Analysis (PCA) and Linear Discriminant Analysis (LDA).
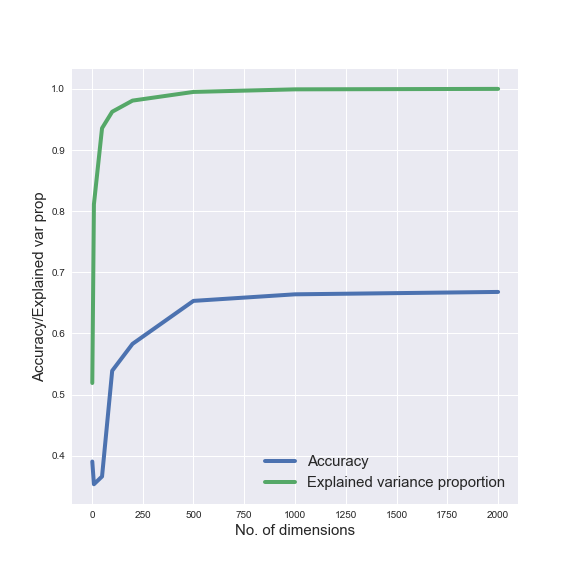
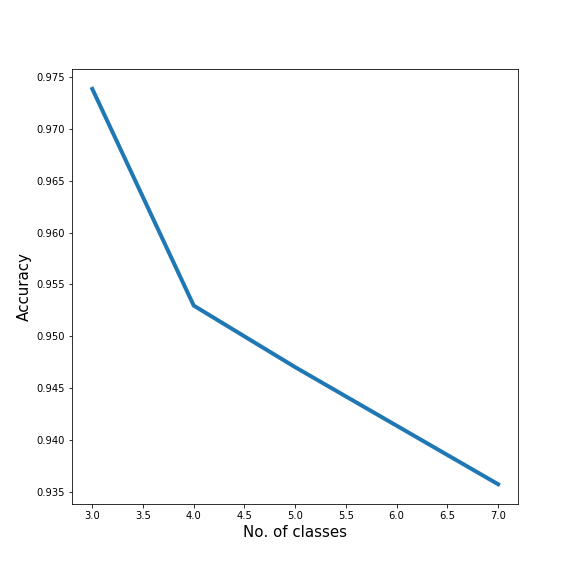
Additionally, in order to understand how the dimensionality of our data influences classification, we analysed how the performance of a classifier - Support Vector Machine (SVM) - depends on the number of dimensions we use to represent our data. Similarly, we also observed how classification performance is affected by the number of classes included in our data.
Supervised Learning
We compared outcomes between three different methods: Support Vector Machine, Convolutional Neural Network, and Random Forest Classifier. Support Vector Machines have been shown to generalize well to large image datasets[2], Convolutional Neural Networks allow for localized information sharing (taking advantage of images’ spatial layout), and decision trees are a widely used classification method[1].
Transfer Learning
In an attempt to improve accuracy, we looked at other competitors within the kaggle competition to see what methods were being applied to improve accuracy. We found one of the competitors used a concept called transfer learning, where a portion of a different pre-trained model is used, and the bottom of the model changed and trained on for the new dataset. In this case, we used the MobileNet classifier and added a final 7 node layer for classification. The concept here is this network has learned some general image features whose representation can be “transferred” to the new classification problem.
PCA
PCA was done on the preprocessed data, after downsampling the 'nv' labels and removing the 4 classes with the lowest amount of data. To visualise our clusters on a 2D plane, we plotted the first two principal dimensions and identified each data point by its true cluster identitiy. As the results are shown below, PCA does not offer a good visual separation between clsuters, likely because the first two principal dimensions fail to capture a significant amount of variability between the 3 classes.

LDA
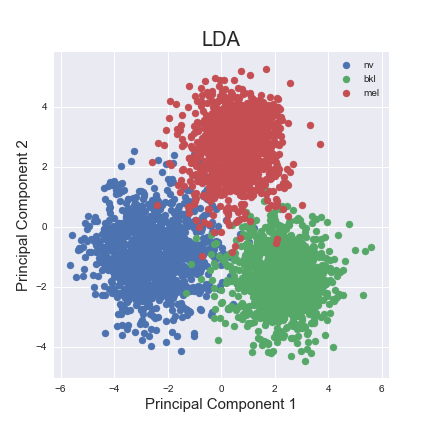
LDA is a supervised learning algorithm which reduces dimensions of our data while maximizing inter-class separability. We performed LDA on our dataset after downsampling the ‘nv labels’ and removing the four classes with the lowest number of samples. As shown below, the two principal components offer a clear separation between the three classes of labels in our data.
We tested how classification performance is affected by adding more classes to our dataset by training an SVM classifier. We found that classification accuracy decreases, but only slightly, from 97.5% to 93.5% as we increase the number of classes from 3 to 7.
SVM
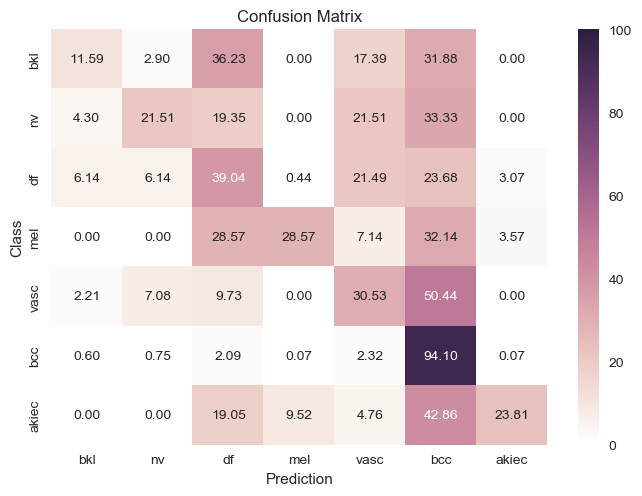
After preprocessing and creating the frameworks for downsampling the data, we fit an SVM classifier to 80% of the data and test it to 20% of the data for these tests.
| Original Data |
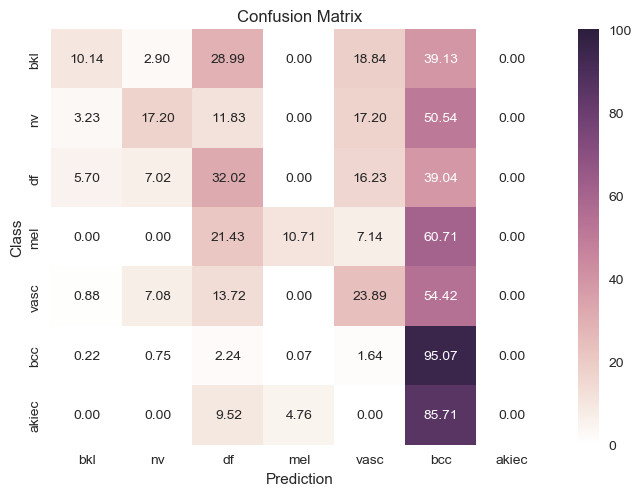 |
Downsampled |
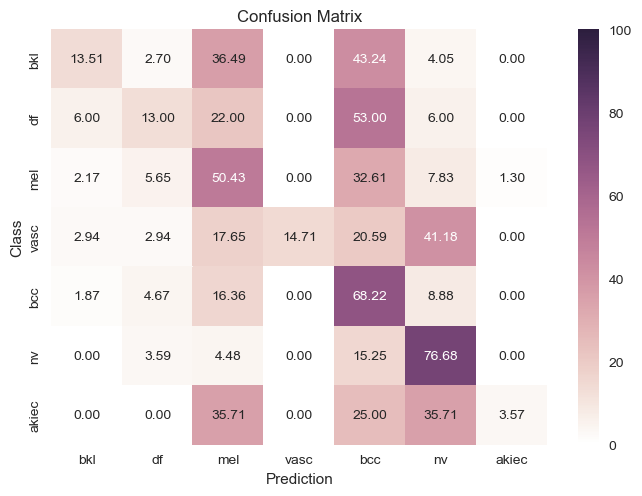 |
| Removed Labels |
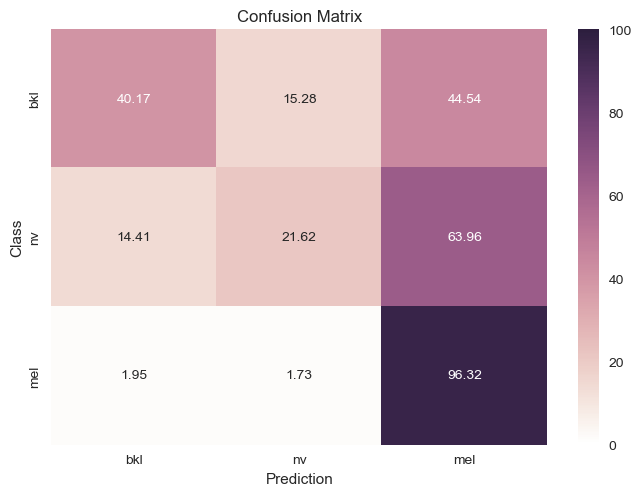 |
Downsampled and Removed Labels |
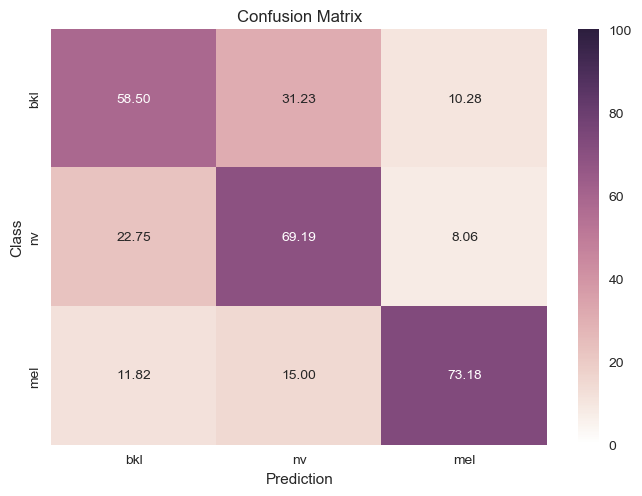 |
SVM after dimensionality reduction with LDA
Based on the finding that LDA was able to clearly separate the different classes in a low-dimensional feature space, we also trained SVM on the principal components generated by the LDA fits. We found that the classification performance of SVM improved significantly when it was trained on these reduced representations.
| Downsampled and Removed Labels |
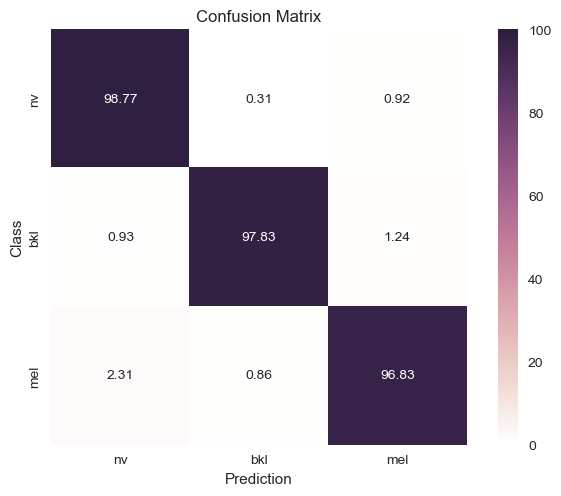 |
Removed Labels |
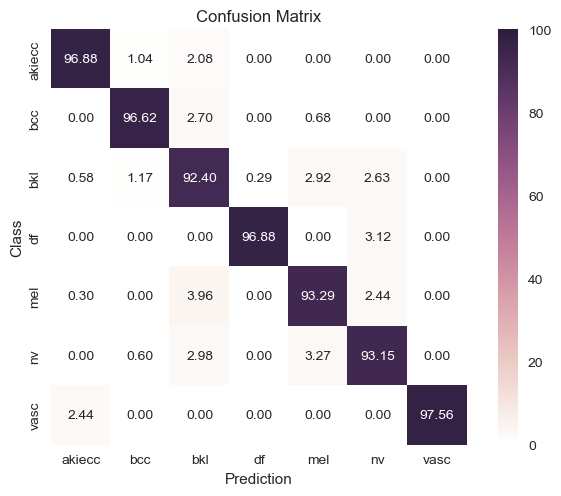 |
CNN
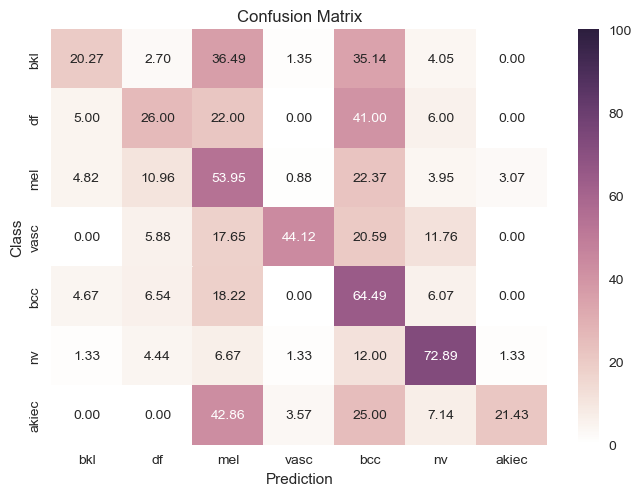
| Original |
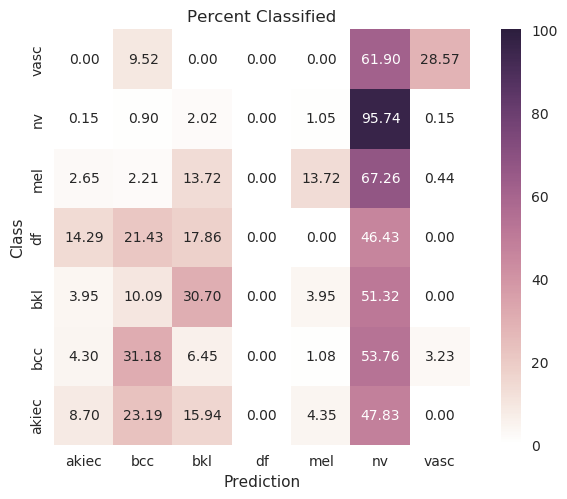 |
Evenly waited loss function |
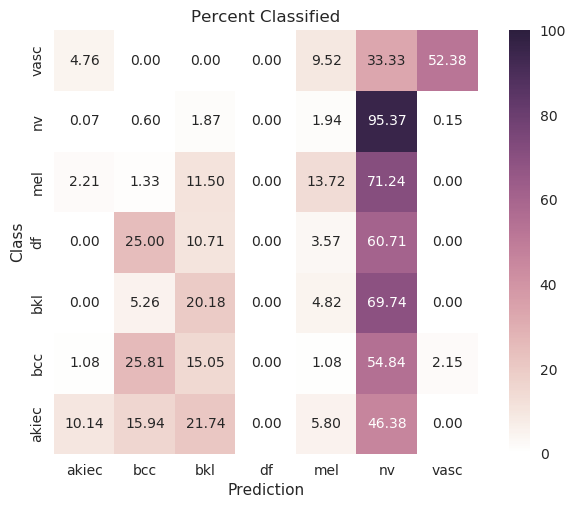 |
MobileNet
| Original |
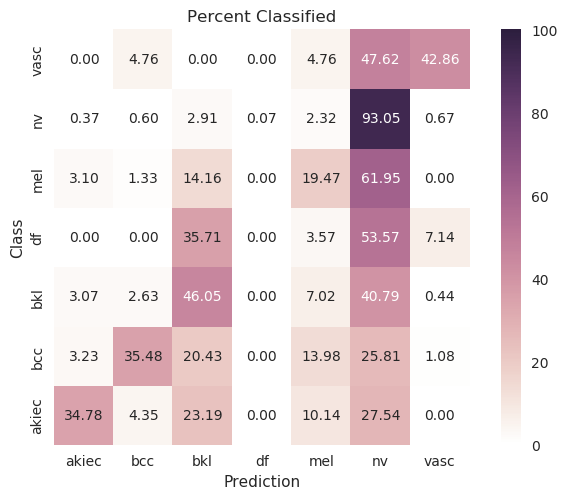 |
Evenly waited loss function |
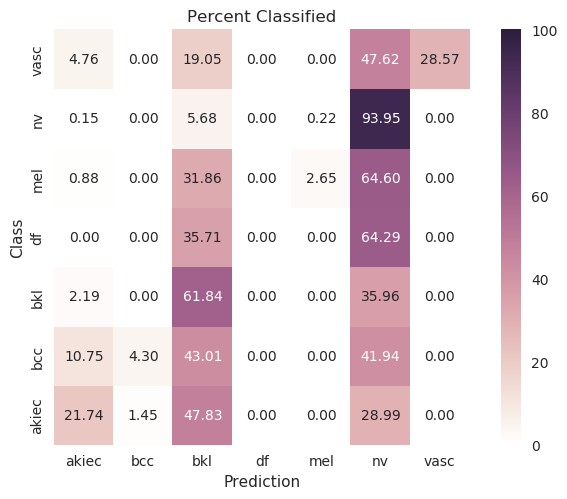 |
Analysis
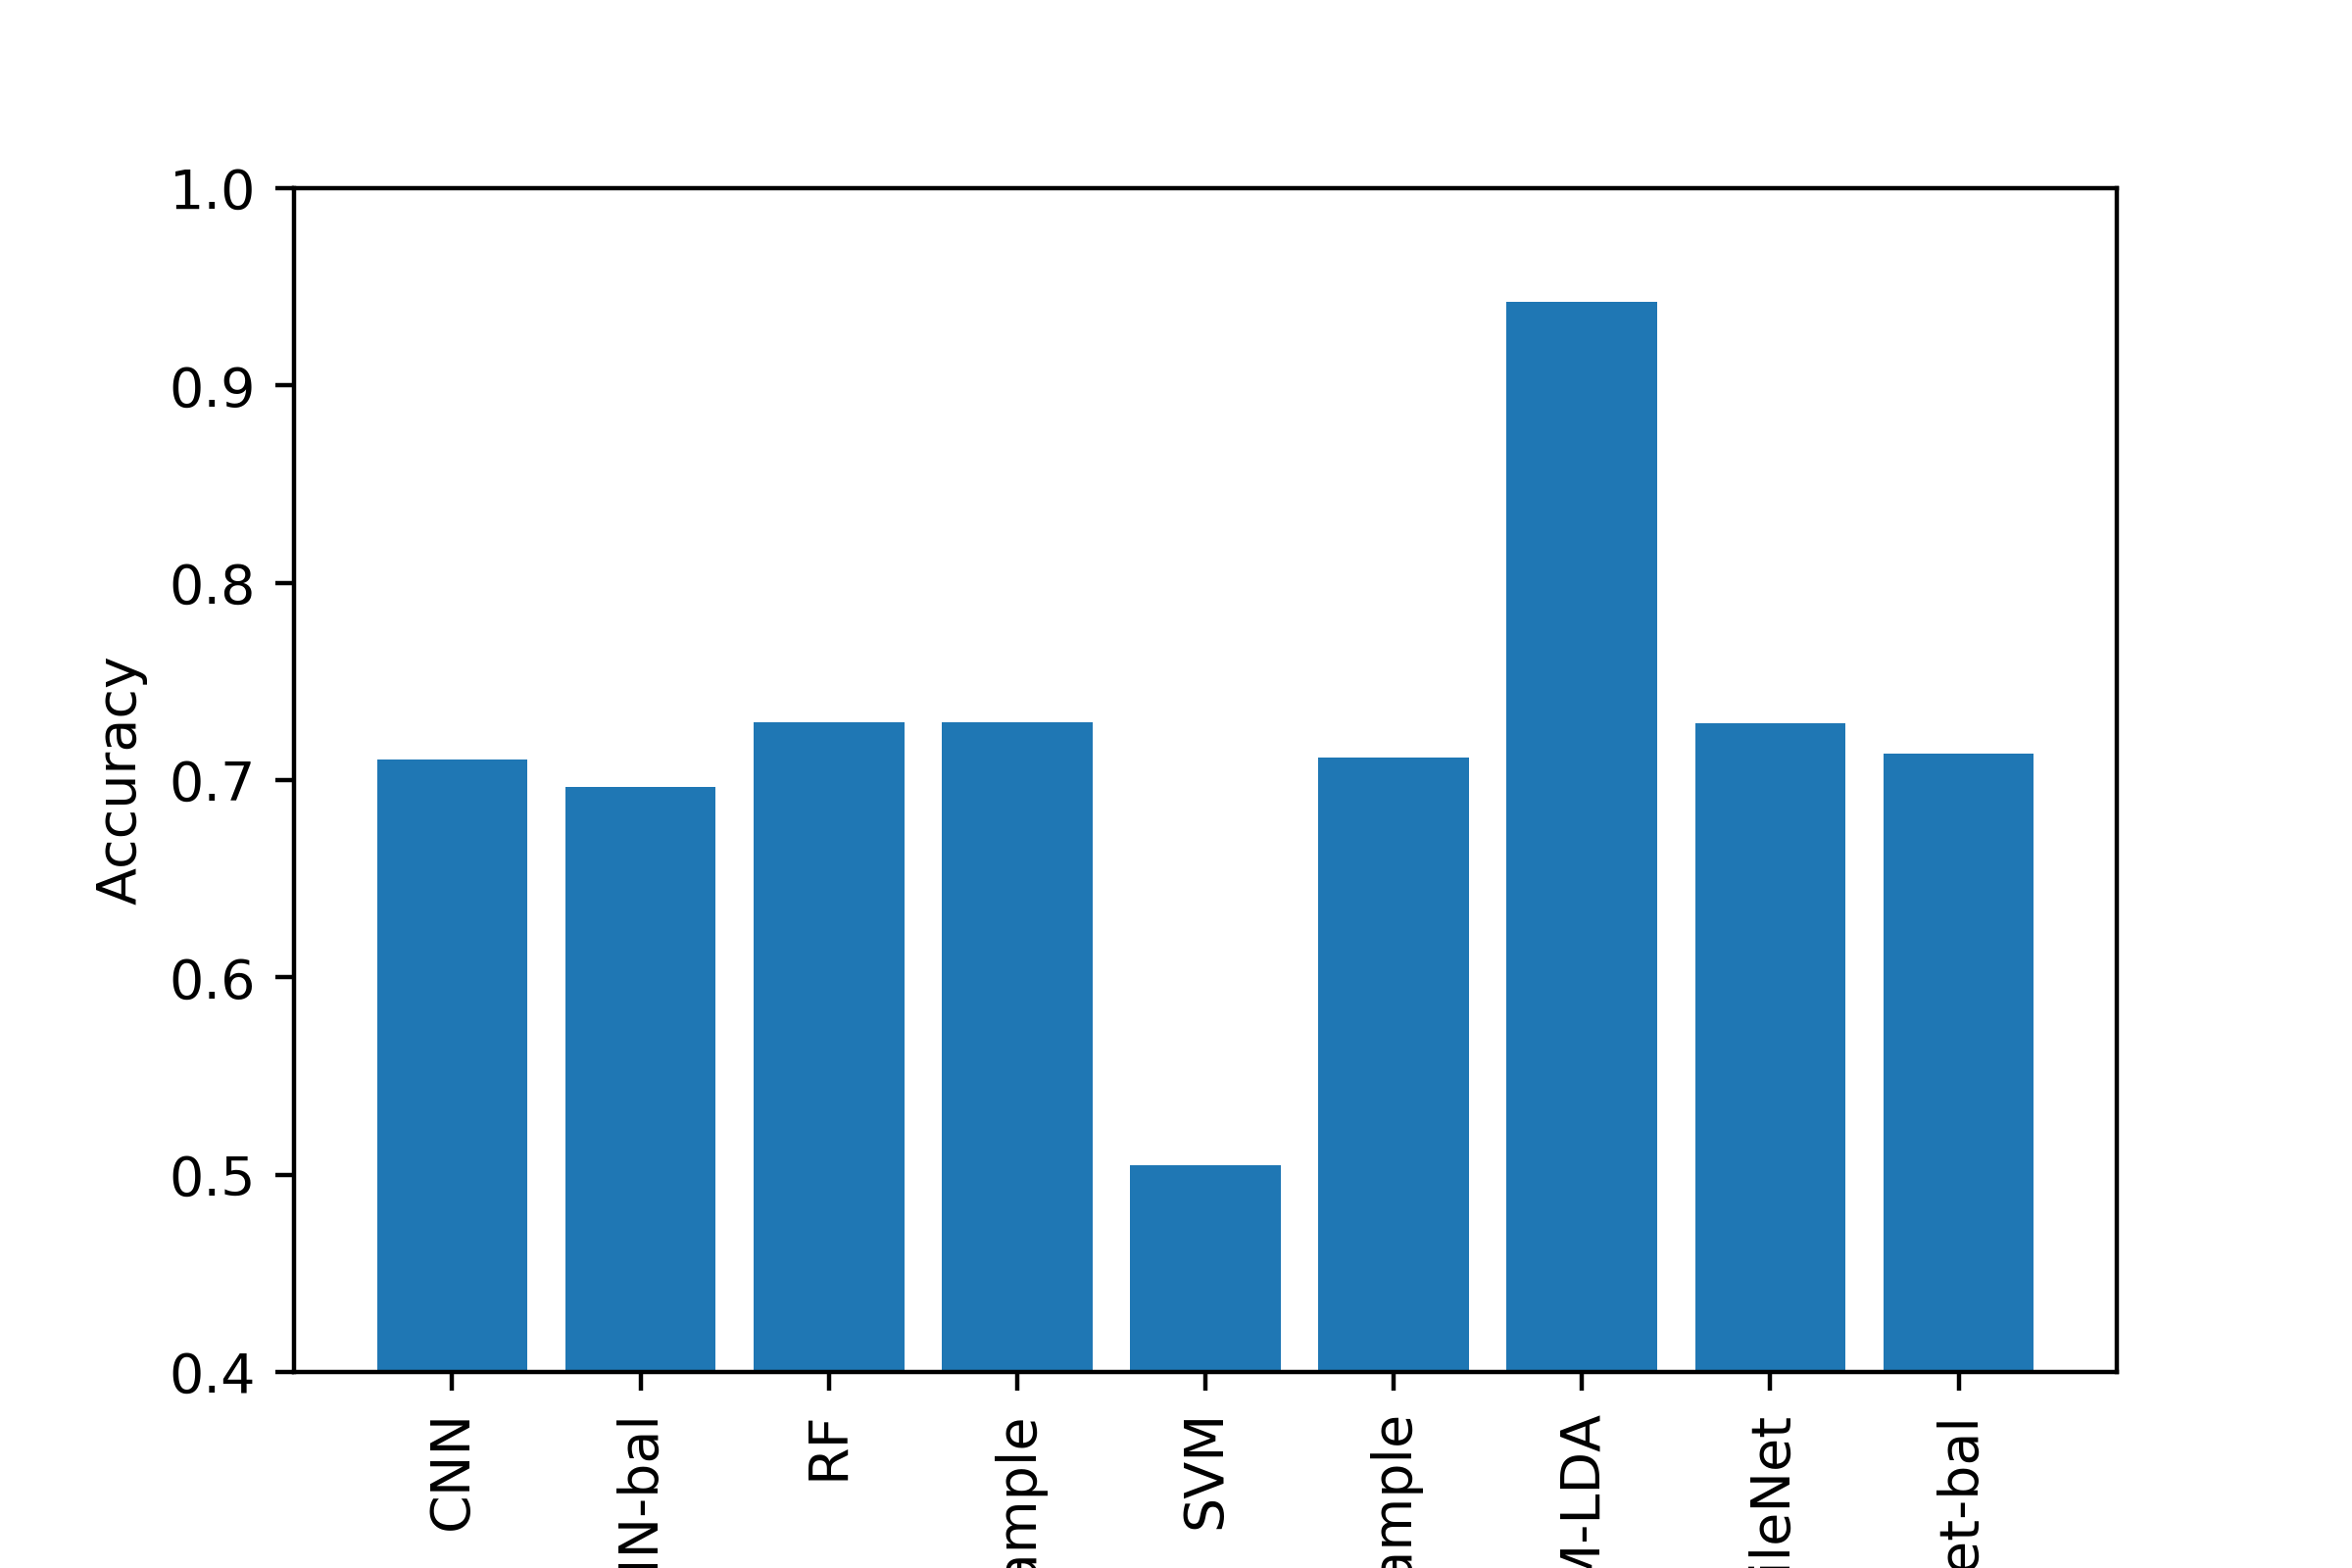
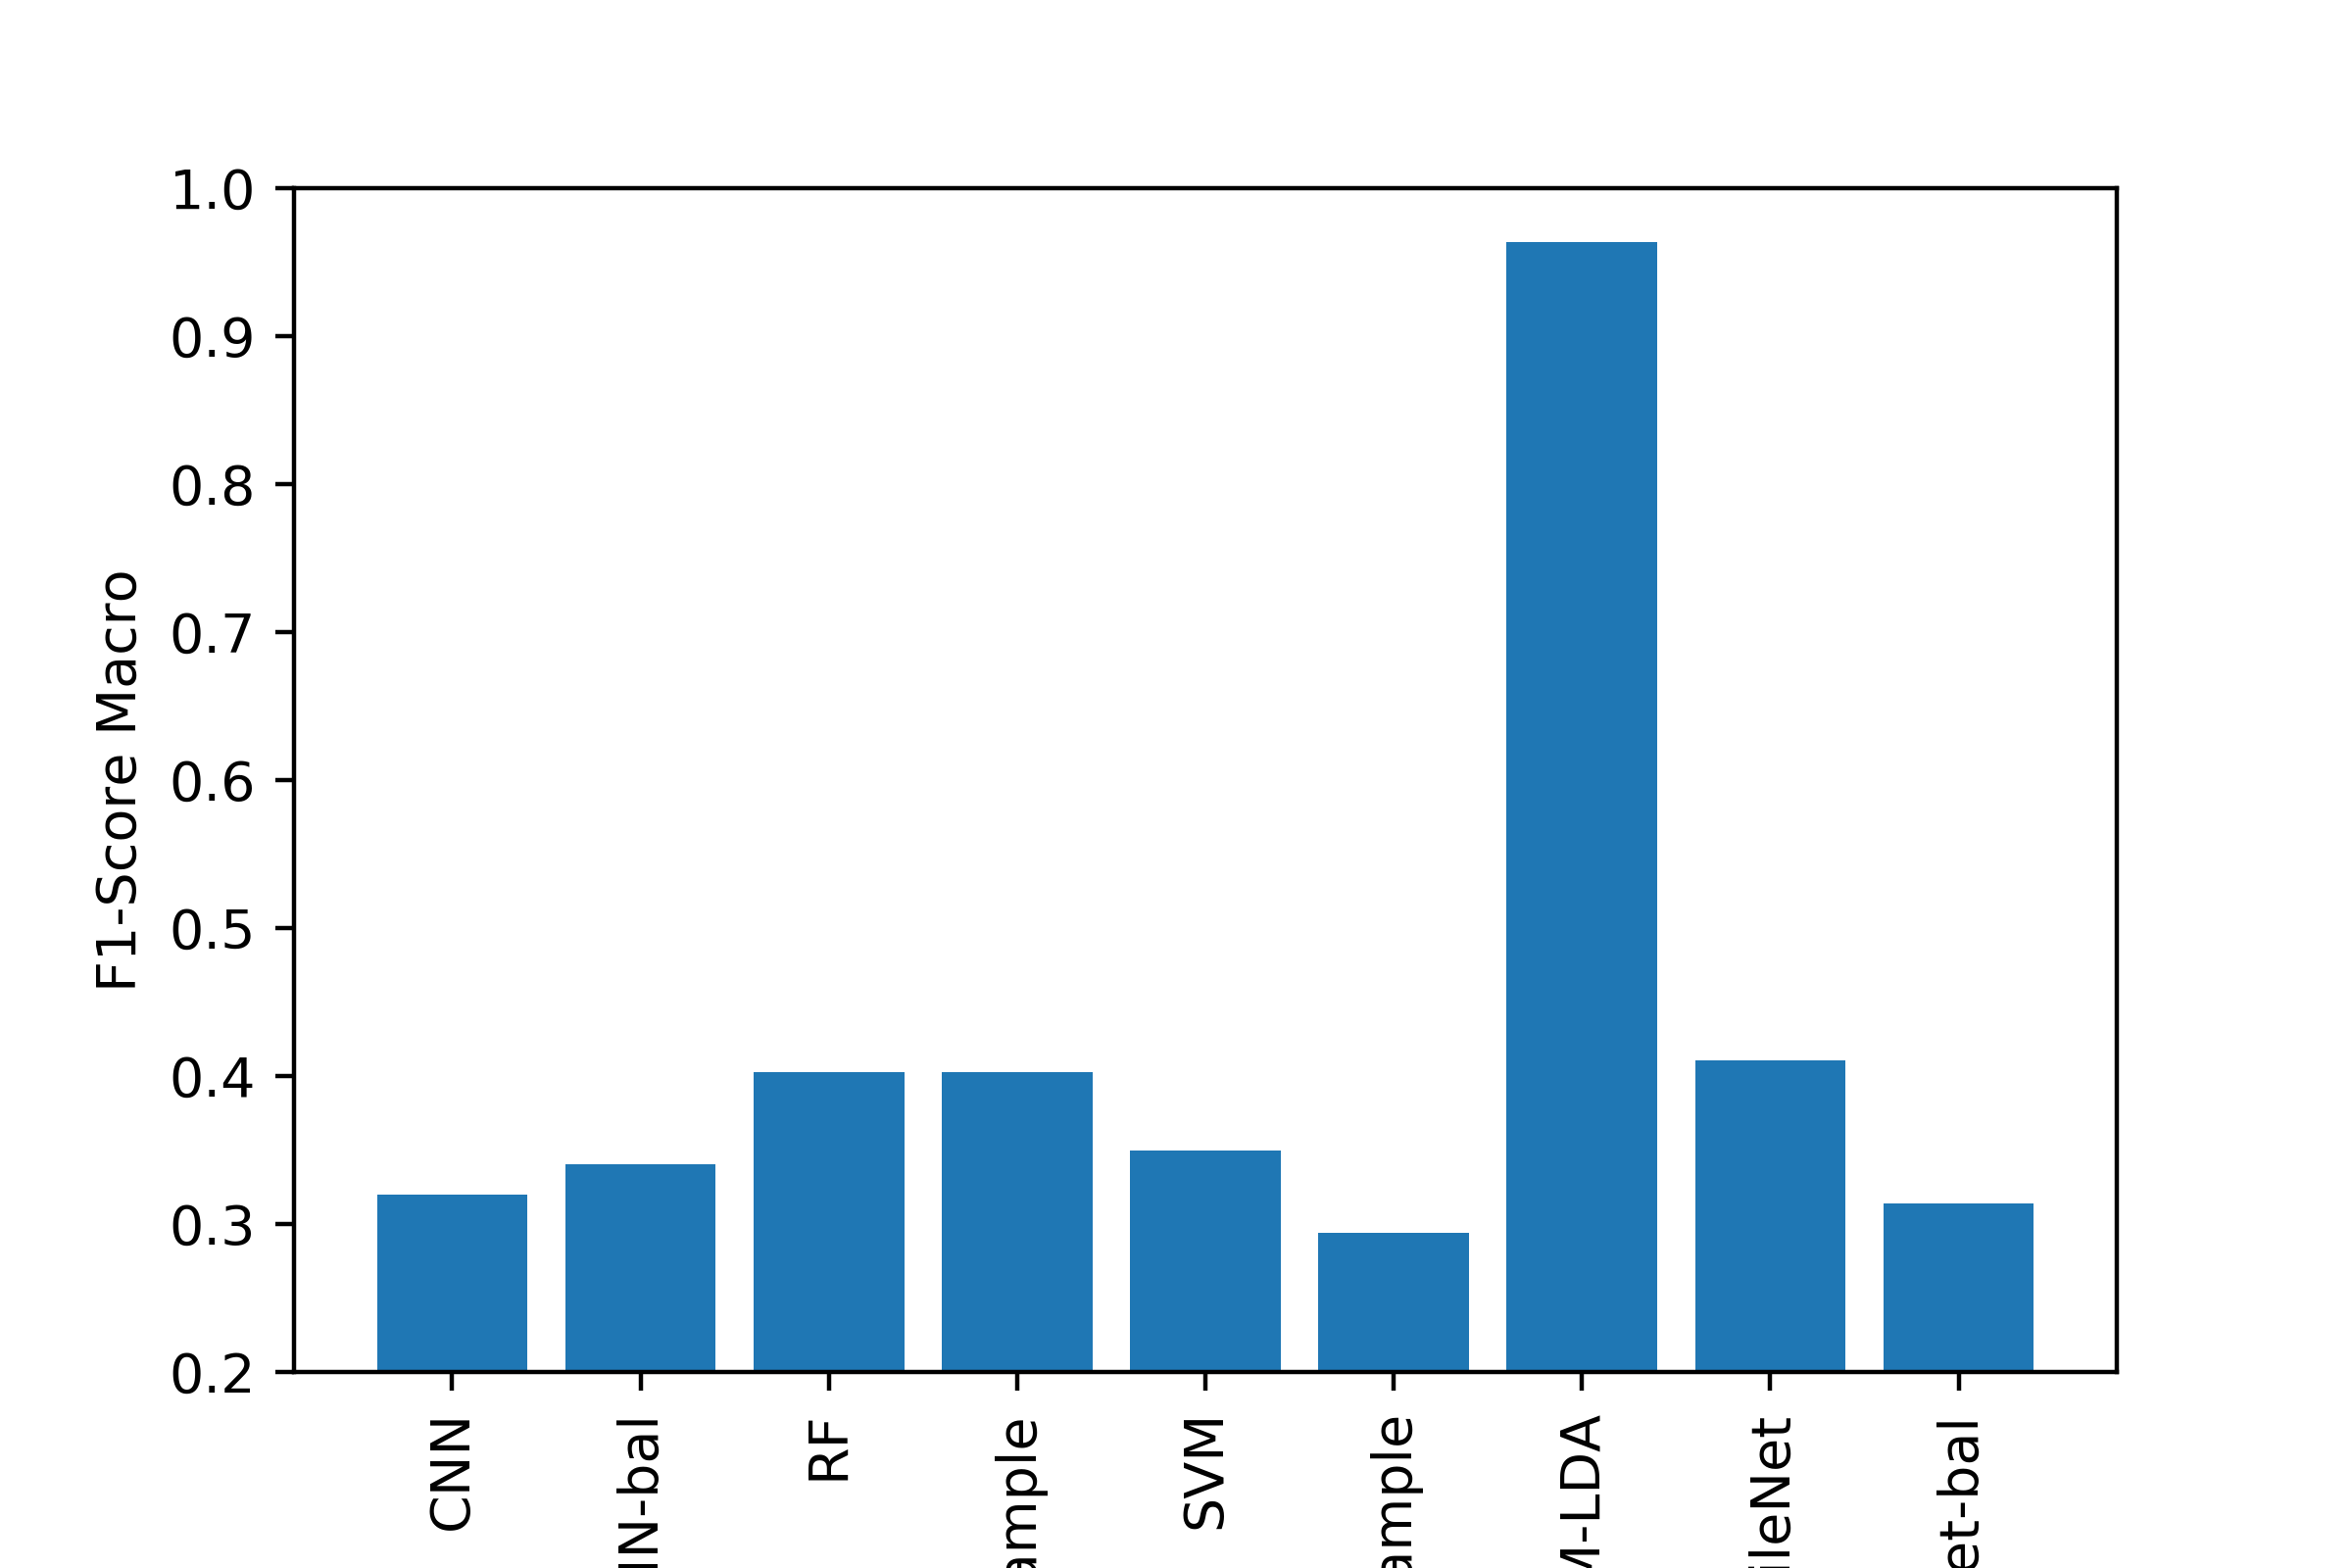
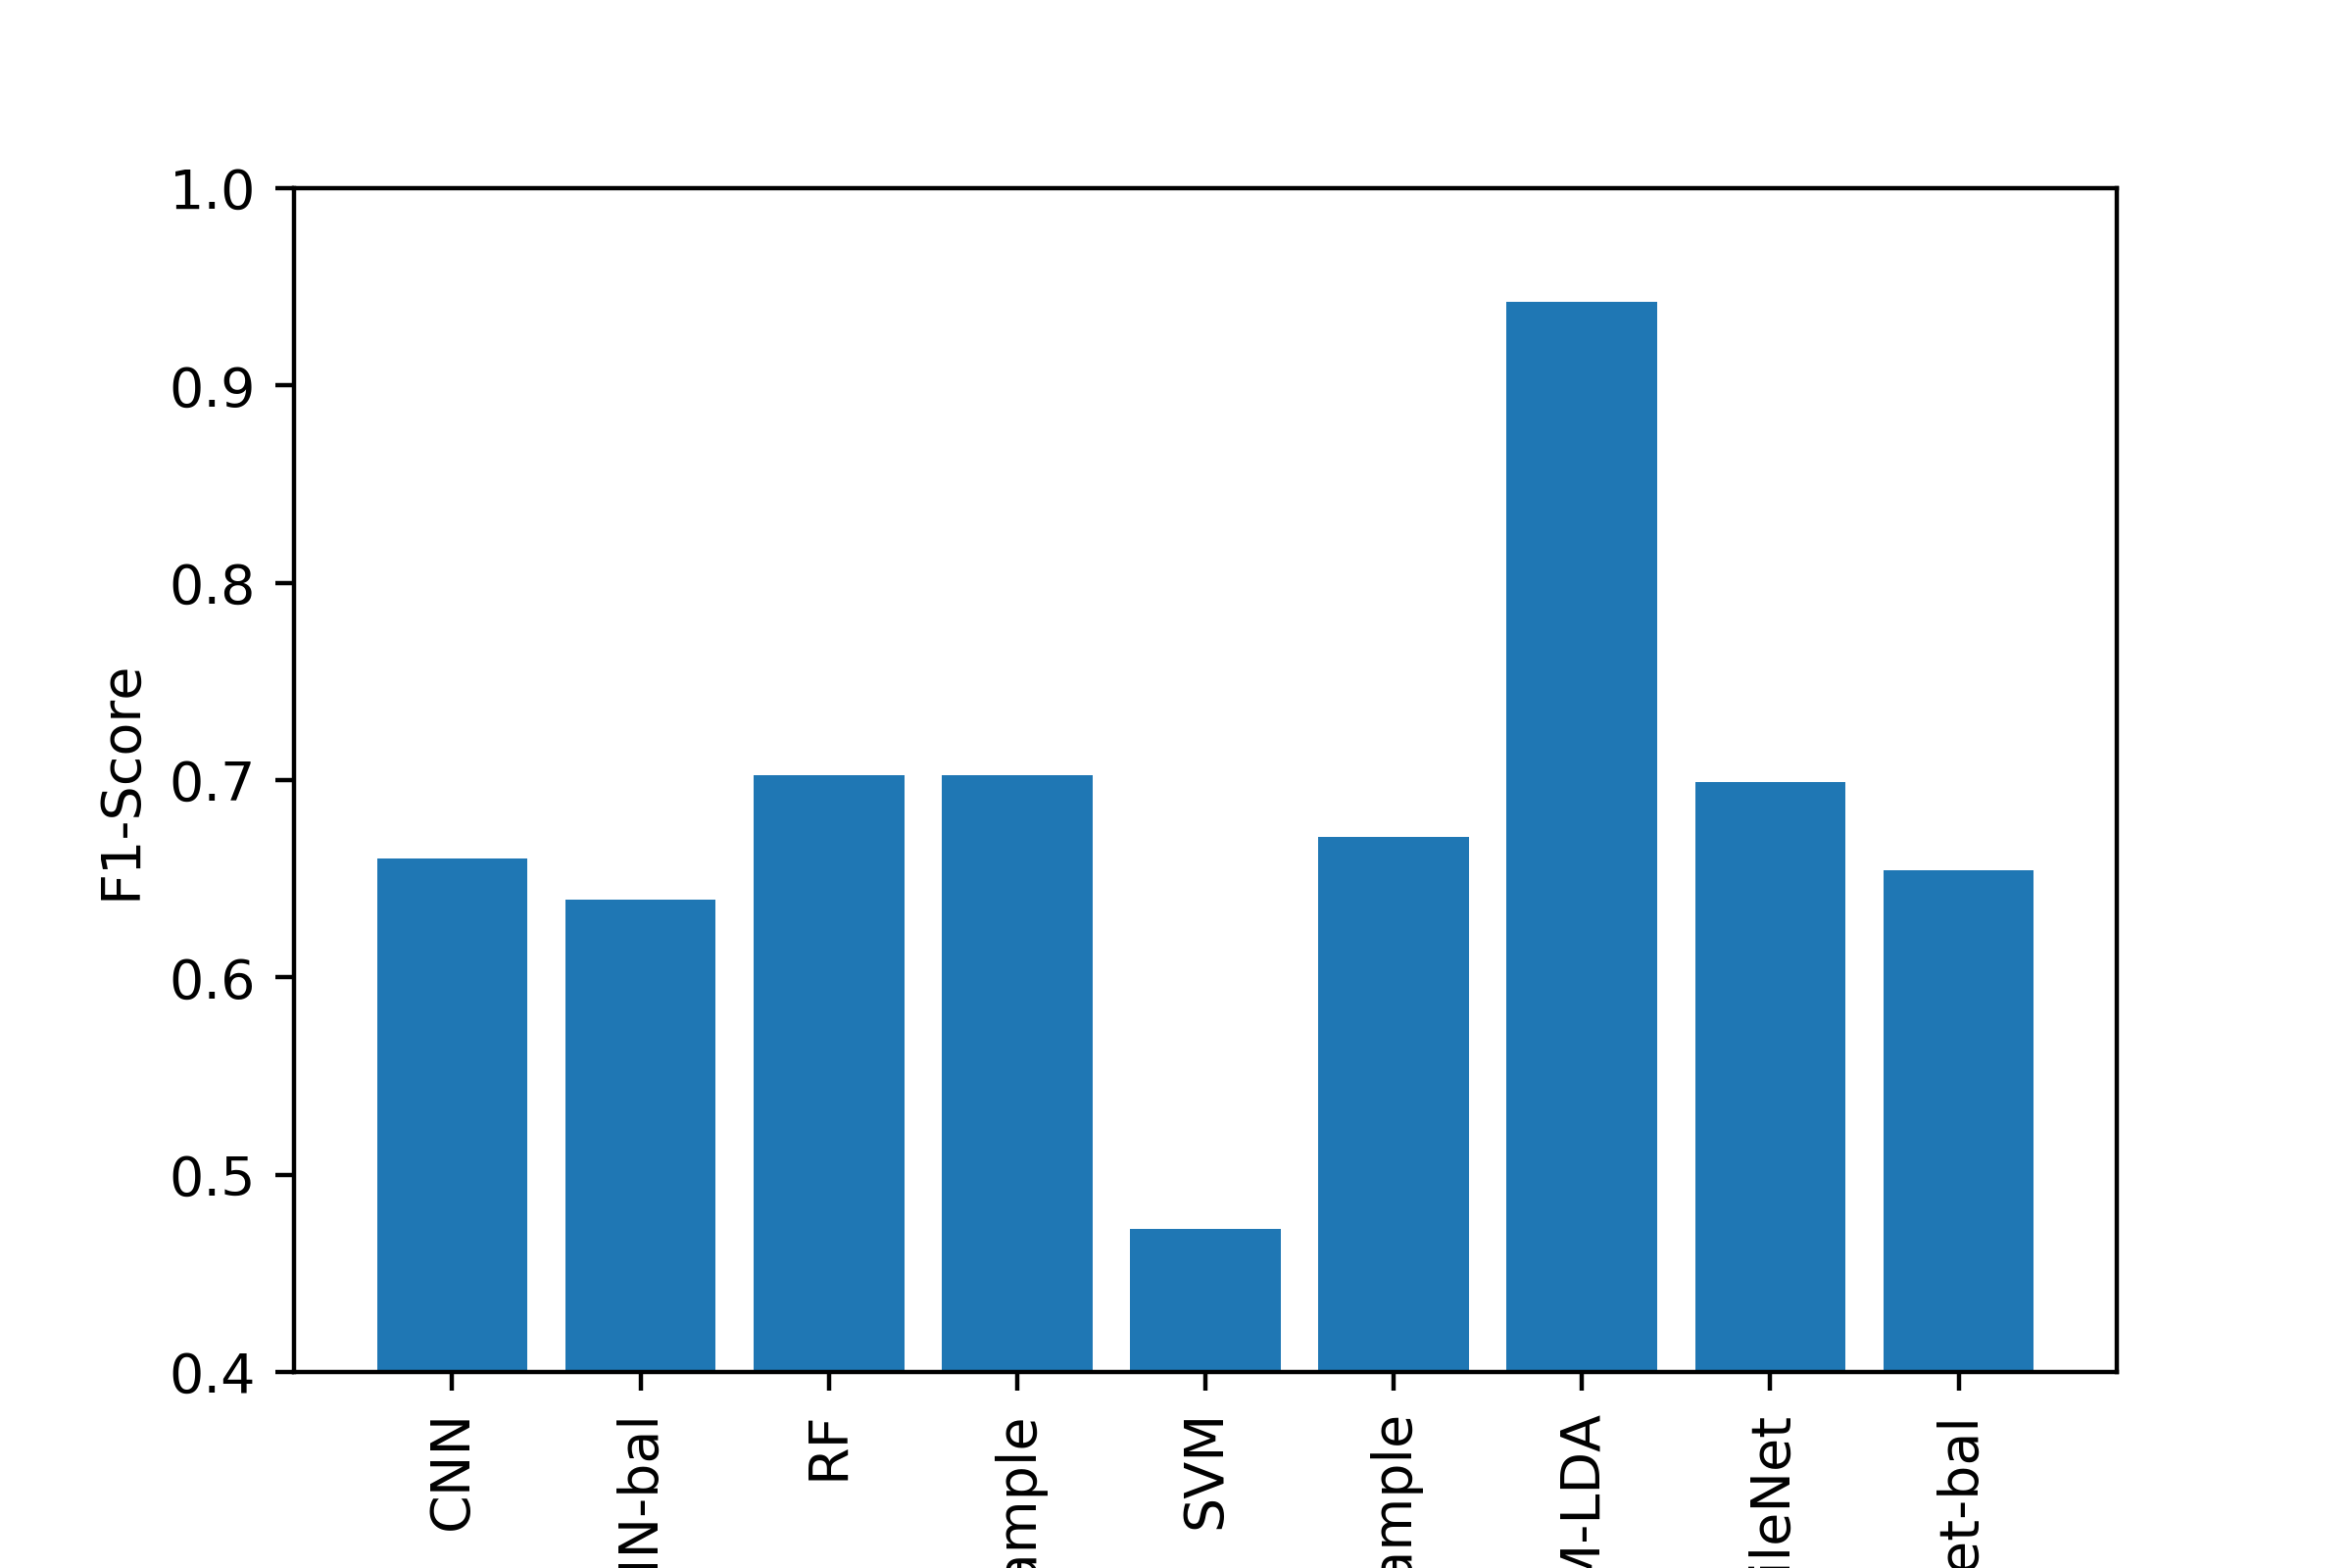
As part of our unsupervised learning, our goal was to cluster/partition the data such that each category of diagnosis was in a separate cluster. We then compared the values for each cluster to see if the diagnosis was made appropriately. As part of unsupervised learning, we wanted to look at how descriptive our features were in relation to clustering certain disease types together. If our clusters are well separated, then the information we have is a good descriptor. For supervised learning, our goal was be to correctly identify different lesion/disease types. We compared the performance of three different models.
Conclusion
Most of the machine learning algorithms performed comparably, with the exception of using LDA to transform the image data before SVM, which was the best classifier by all metrics. Generating a good classifier for this problem could have major impacts, as 5,000,000 cases of Skin Cancer are diagnosed annually, and early detection of dangerous forms like melanoma can increase survival rate to exceed 95%.
Future Work
Since LDA lead to such dominant results, we think future work may try using these transformed features as the input to models other than SVM. Additionally, the CNN and MobileNet architectures could be trained for a longer time or their layout be changed to include the metadata other than the image. Finally, more data augmentation and downsampling could be applied to try to improve performance.
References
[1] Brinker, T. J., Hekler, A., Utikal, J. S., Grabe, N., Schadendorf, D., Klode, J., . . . Von Kalle, C. (2018, October 17). Skin Cancer Classification Using Convolutional Neural Networks: Systematic Review. Retrieved from https://www.ncbi.nlm.nih.gov/pmc/articles/PMC6231861/
[2] Chapelle, O., Haffner, P., & Vapnik, V. N. (1999). Support vector machines for histogram-based image classification. IEEE transactions on Neural Networks, 10(5), 1055-1064.
[3] Esteva, A., Kuprel, B., Novoa, R. A., Ko, J., Swetter, S. M., Blau, H. M., & Thrun, S. (2017). Dermatologist-level classification of skin cancer with deep neural networks. Nature, 542(7639), 115–118. doi: 10.1038/nature21056
[4] Noel Codella, Veronica Rotemberg, Philipp Tschandl, M. Emre Celebi, Stephen Dusza, David Gutman, Brian Helba, Aadi Kalloo, Konstantinos Liopyris, Michael Marchetti, Harald Kittler, Allan Halpern: “Skin Lesion Analysis Toward Melanoma Detection 2018: A Challenge Hosted by the International Skin Imaging Collaboration (ISIC)”, 2018
[5] Tschandl, P., Rosendahl, C. & Kittler, H. The HAM10000 dataset, a large collection of multi-source dermatoscopic images of common pigmented skin lesions. Sci. Data 5, 180161 (2018). doi: 10.1038/sdata.2018.161
